Estimating the extent of heterogeneity
Refer to the Forest Plot sheet in the User Manual for details on how to run the analysis.
The workbooks and a pdf version of this guide can be downloaded from here.
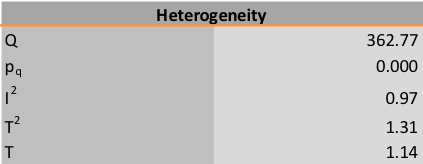
As suggested in the section 'confidence interval: hypothesis testing', the combined effect size (and its confidence interval) is not a useful outcome of the meta-analysis as presented in Figure 1. The plot in Figure 1 itself suggests that there are different effect sizes in different types of populations. In other words, the domain that is analysed in this meta-analysis must be seen as “heterogeneous”. It consists of parts (or sub-domains), each with a different “true” effect size. The forest plot sheet of Meta-Essentials provides numerical information about the degree of heterogeneity. Four types of information about heterogeneity are provided: the Q-statistic with a p-value; I2; T2; and Tau (see Figure 4).

Figure 4: Part of forest plot sheet in Meta-Essentials, with information about heterogeneity
The Q-statistic (also referred to as “Cochrane’s Q”) is the weighted sum of squared differences between the observed effects and the weighted average effect. (See Borenstein et al., 2009: 109-113, for how Q is computed.) The Q-statistic is only a measure of variation around the average and is not yet a measure of heterogeneity. In order to compute the heterogeneity, Q must be compared with the variation that would be observed if all studies were studies of a probability sample from the same population. This difference is computed in a meta-analysis with two main aims: (1) a null hypothesis significance test can be performed on this difference; and (2) it is used for calculating the other measures of heterogeneity. In the example the p-value is 0.000. The test of the null hypothesis is subject to the same caveats as all tests of significance (see Borenstein et al., 2009: 112-113). The p-value is not an effect size and, hence, is not a measure of the extent of heterogeneity. A low p-value only indicates that there probably is some (undetermined) degree of heterogeneity. As in any significance test, non-significance of Q in a study cannot be used as evidence for the null, in this case for homogeneity of the domain studied. Meta-analysts, thus, should not look at the value of Q nor its p-value. Rather, they should interpret the other measures of heterogeneity.
I2 is a measure for the proportion of observed variance that reflects real differences in effect size. (See Borenstein et al., 2009: 117-119, for how I2 is computed.) It is expressed as a percentage with a range from 0 to 100 percent. It is a relative measure. It is not a measure of variation in terms of the scale of the effect size parameter. Hence its usefulness is limited. Borenstein et al. (2009: 119) advise to use I2 as a criterion for a decision whether a subgroup analysis or moderator analysis is indicated. If I2 is low, then there is no heterogeneity to speak of and hence nothing to be explored in a subgroup or moderator analysis. If I2 is large, then such an analysis is likely to be worthwhile. In the example, I2 is 97%. This very high proportion suggests that the studies in this meta-analysis cannot be considered to be studies of the same population.
Both T2 and Tau are measures of the dispersion of true effect sizes between studies in terms of the scale of the effect size. (See Borenstein et al., 2009: 114-117, for how T2 and Tau are estimated.) T2 is an estimate of the variance of the true effect sizes. Or, in the words of Borenstein et al. (2009: 114): “If we had an infinitely large sample of studies, each itself infinitely large (so that the estimate in each study was the true effect) and computed the variance of these effects, this variance would be T2”. T2 is not used itself as a measure of heterogeneity but is used in two other ways: (1) it is used to compute Tau; and (2) it is used to assign weights to the studies in the meta-analysis under the random-effects model. Tau is an estimate of the standard deviation of the distribution of true effect sizes, under the assumption that these true effect sizes are normally distributed. Tau is used for computing the prediction interval.
Summarizing, how should this multiple information about heterogeneity be interpreted and used? We recommend to use I2 as the main source of information about the extent of heterogeneity. As soon as I2 is larger than an (arbitrary) proportion (say 25%), the meta-analyst should not interpret the combined effect size as meaningful and should not conduct any form of significance testing. After such a decision has been made, the meta-analyst should focus on an analysis of the dispersion of true effect sizes, and of its determinants (moderators). Tau is a useful first indication of the extent of this dispersion. However, the prediction interval is a more direct and more easily interpretable indicator.
Reference
Michael Borenstein et al. (2009), Introduction to Meta-Analysis, Chichester (UK): Wiley.


