Publication bias analysis
Refer to the Publication Bias Analysis sheet in the User Manual for details on how to run the analysis.
The workbooks and a pdf version of this guide can be downloaded from here.
The set of studies undertaken in a field of study is likely to be biased in many ways. The best known example of such selection bias is the fact that almost all psychological experiments are studies of convenience samples of students. It is very unlikely that experiments with normal people would generate similar effect sizes. One reason for low levels of heterogeneity in psychological experiments might be that they all study the same type of person. This potential selection bias cannot be detected in a meta-analysis of the studies that have been conducted, for the simple reason that a meta-analysis can only draw conclusions from its input and not from what is absent in that input. Because a meta-analytic result is always only a result for the set of populations for which effect size estimates are included in the analysis, the researcher should always be very reluctant in drawing conclusions for a domain.
One form of selection bias that might be detected in the meta-analysis itself is publication bias. In a publication bias analysis it is assumed that the domain is homogeneous, implying that there is no bias even if though the selection of populations for studies is arbitrary. Publication bias analysis is concerned with selection bias that might occur after studies have been conducted, namely when some studies are published and others are not published. It is hypothesized that the chance that a statistically significant result is published is higher than a statistically non-significant result. Hence, the combined effect size in the study might be larger than it is in reality. The publication bias analysis is aimed at (1) signaling this potential publication bias and (2) adjusting the estimate for the combined effect size. Note that this makes sense only in a homogeneous set of results in which the combined effect size can be interpreted as an estimate of a true effect size in the population.

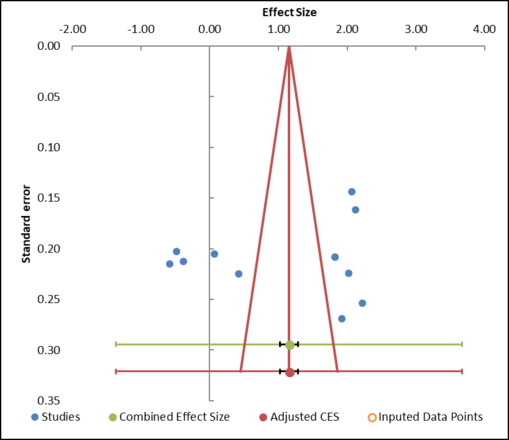
Figure 10: Example of a funnel plot
Meta-Essentials offers six different analyses that might indicate publication bias. One analysis is a funnel plot. It is assumed that observed effect sizes with similar precision (i.e., with similar standard error) should be more or less symmetrically distributed around the combined effect size. As mentioned above, it is hypothesized that there will be more results far from the null than closer to the null. This is not the case in the example (Figure 10). Since there are no imputed data points (based on the Trim-and-Fill method), the funnel plot indicates there is no asymmetry in the distribution of effect sizes. However, if we would find asymmetry, the Trim-and-Fill method would impute one or more studies and therewith adjust the combined effect size for the potentially missing studies.
This, again, is an example that illustrates that results of procedures in a meta-analysis, hence also in Meta-Essentials should be interpreted with much caution. In this specific example, the result of the funnel plot cannot be interpreted because of the high level of heterogeneity in this set of effect sizes. Publication bias analysis should be performed in a set of homogeneous results only.
The same caution should be applied in the interpretation of the other five estimates of publication bias that are generated in Meta-Essentials. None of them has a meaning when generated in a heterogeneous set of studies and, hence, they should only be performed in subgroups of which it is known (through a subgroup analysis) that they are homogeneous. Furthermore, these other five estimates have only diagnostic value – they might help to discover publication bias – but do not provide for an adjusted combined effect size.


